How to debug zone flags
Resources
Example application: A demo application is available on GitHub.
As zone-flags mingle with the patching mechanism of zone.js and its usage in Angular it is not always trivial to understand the introduced changes and the impact.
We can debug the zone.js behavior over:
- Browser console
- DevTools performance tab
- Break Points
Let's take some real examples to exercise those options.
The minimal setup looks like this:
@Component({
  selector: 'app-name',
  template: '<div (click)="onClick()">click me</div>',
})
export class AppComponent {
  onClick() {
    setTimeout(() => LOG, 0);
  }
}
The zone flag used is the timers flag.
In zone-flags.ts place the following content:
window.__Zone_disable_timers = true;
Browser console
Besides the patching of existing APIs zone.js also add additional properties to the globalThis object (window in the browser).
The interesting part here is:
The flags we set on the globalThis object
And unpatched APIs zone.js maintains over the globalThis object
Before (timer APIs are patched):
We can check if the flag is un-set by accessing the window object directly:
console.log(window.__Zone_disable_timers); // logs 'undefined' if the flag is active

Another, more direct way how we can check if the zone actually patched the respective API or not is to look for the APIs original version which is maintained on the globalThis object if zone.js applied the patch.
If it is not present, clearly zone.js did not patch the API in question.
// logs the unpatched/original setTimeout API if zone was active, or it logs 'undefined' if not active
console.log(window.__zone_symbol__setTimeout);
console.log(window.__zone_symbol__clearTimeout);
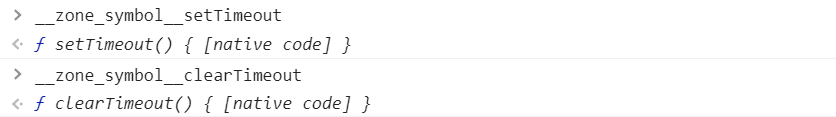
After (timer APIs are patched):
If you used the zone-flag for timers you should see the opposite of our above logs.
The check if the flag is set should now return true:
console.log(window.__Zone_disable_timers); // logs 'false' if the flag is active

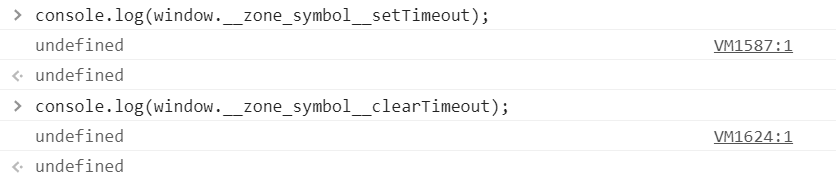
Now, globalThis should have no original/unpatched version present under the zone symbol.
// logs the unpatched/original setTimeout API if zone was active, of it logs 'undefined' if not
console.log(window.__zone_symbol__setTimeout);
console.log(window.__zone_symbol__clearTimeout);
💡 Pro Tips:
- RxAngular offers more convenient ways to configure and debug zone flags. In
zone-flags.tsthe content looks like the following:
import { zoneConfig } from '@rx-angular/cdk';
zoneConfig.global.disable.timers();
- Check zone-flags with RxAngular debug helper
window.__rxa_zone_config__log()in the Browser console.
window.__rxa_zone_config__log(); // logs all active flags
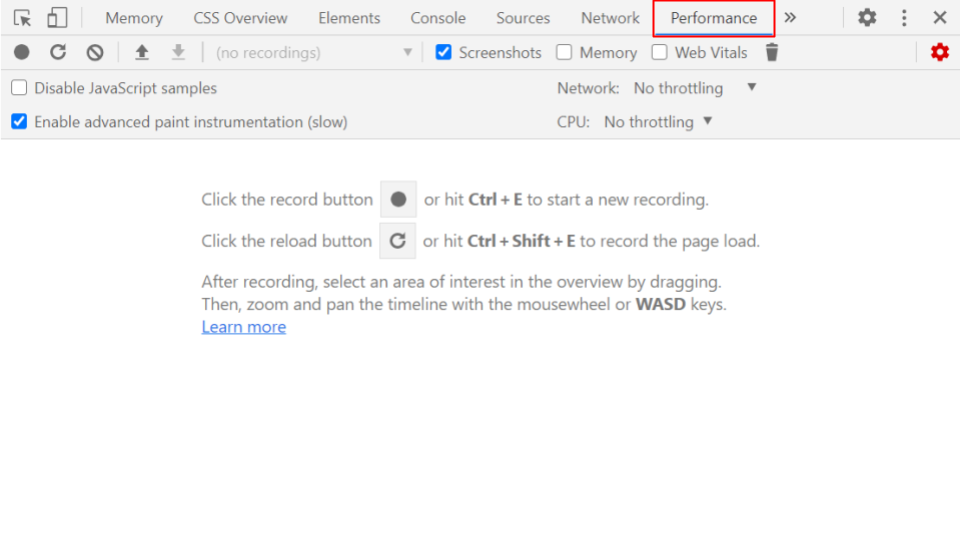
DevTools performance tab
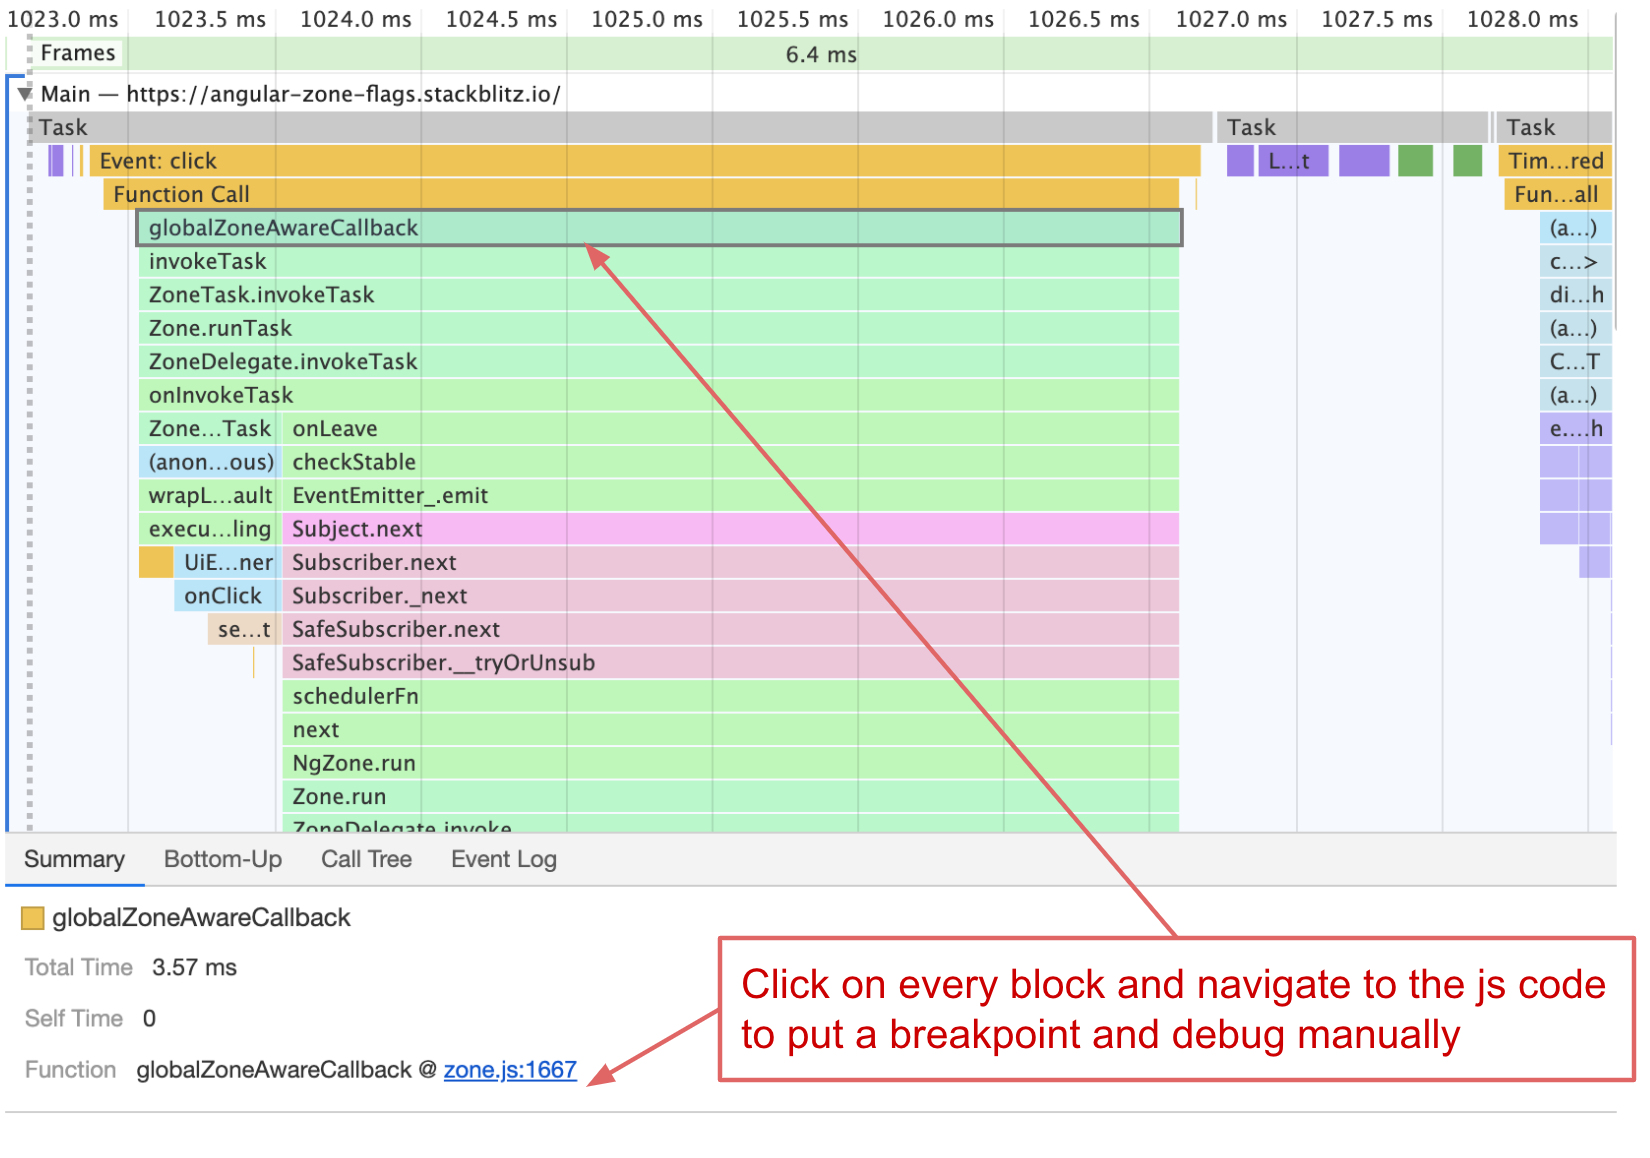
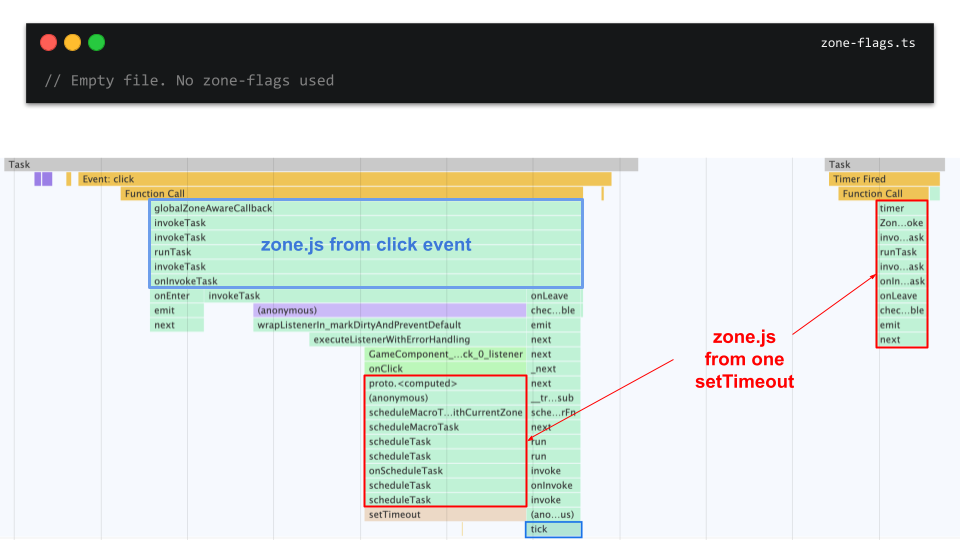
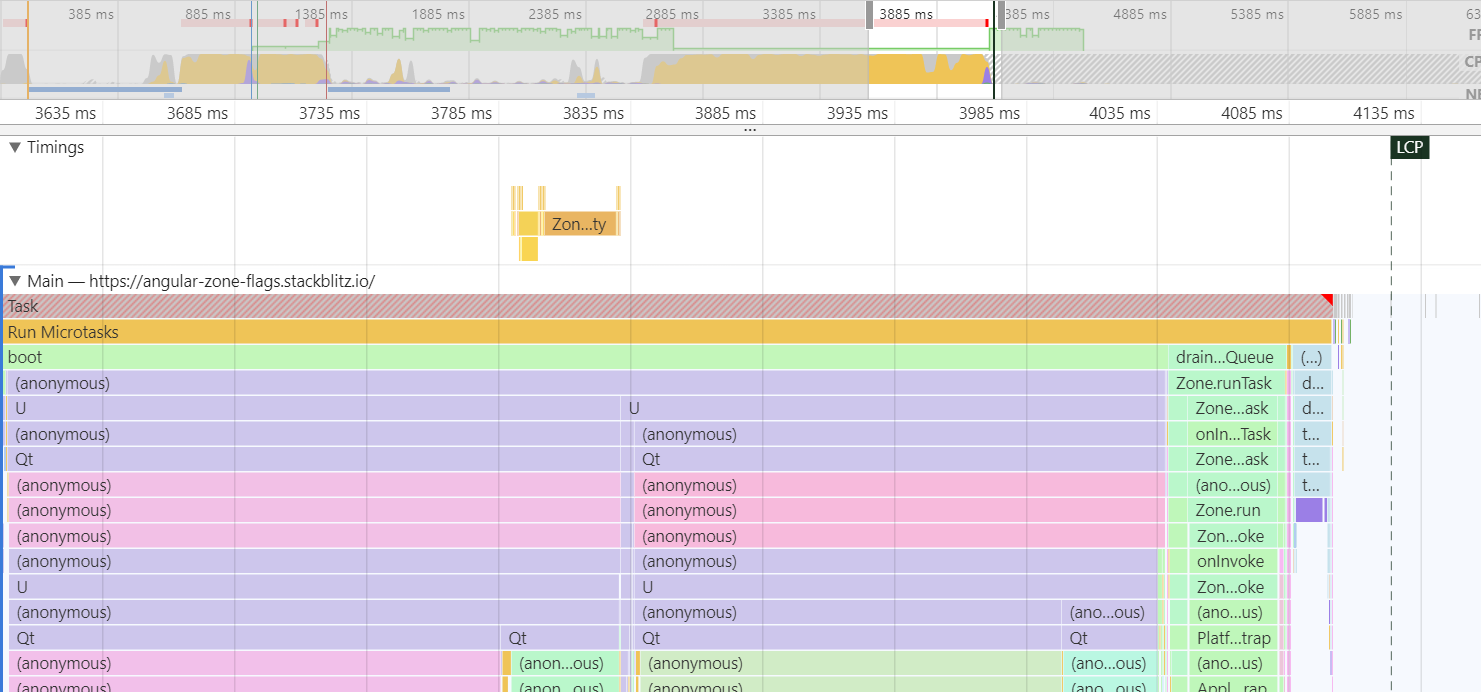
As all the executed JavaScript is present in flame charts, we can also debug zone-flags there.
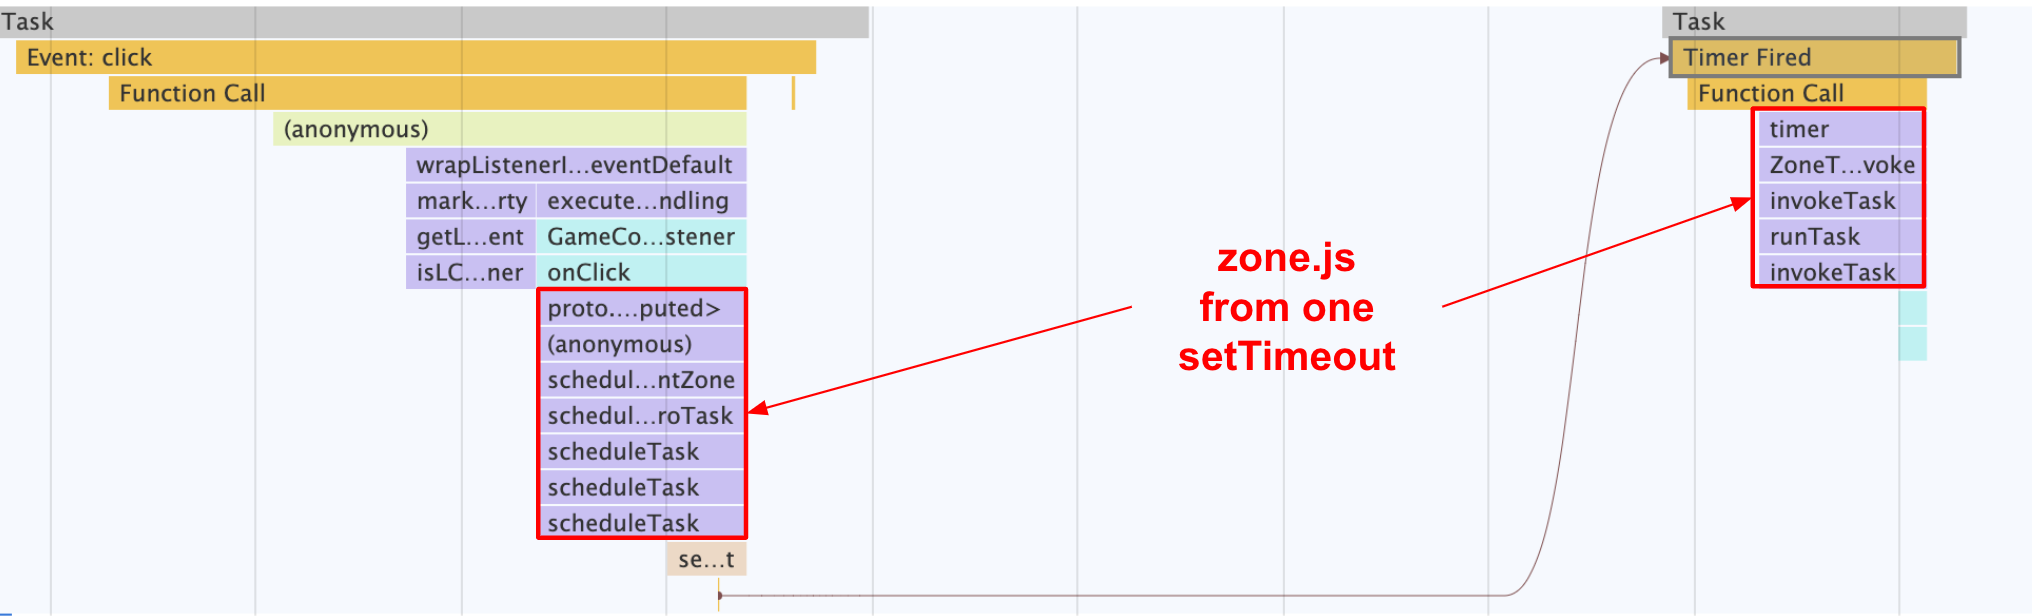
The following images got taken from the performance tab:
In the following, we can see how the flame charts for patched and unpatched timer APIs differ.
Before (without any patches):
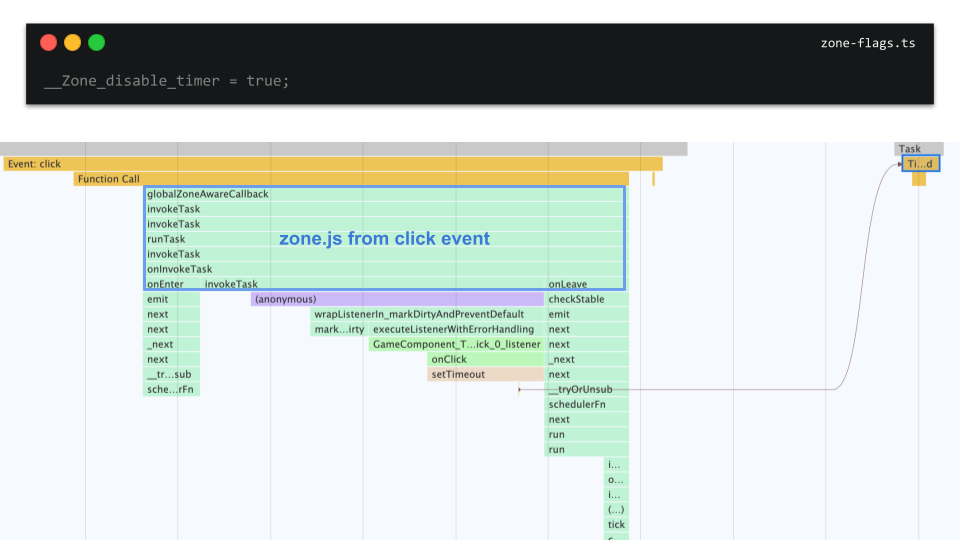
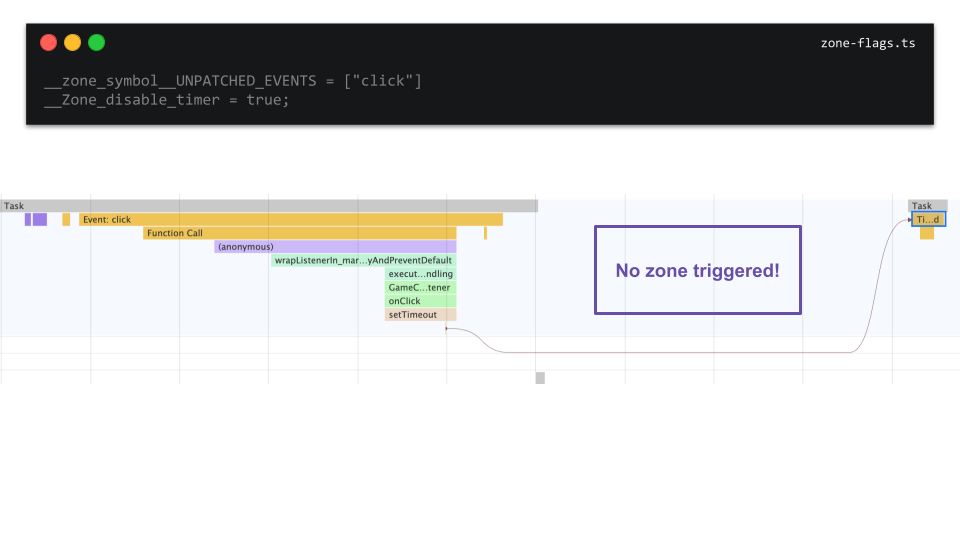
After (with different patches):
__Zone_disable_timer = true;
__zone_symbol__UNPATCHED_EVENTS = ['click'];
__Zone_disable_timer = true;
💡 Pro Tips: Recordings should be fully identical with flags on/off to make a valid comparison. Fully identical means even the mouse moves and time to wait in between the interactions are important. This will make it easy and fast to find the right spot in flames. You can use this tool to compare two charts by drag and dropping the profile measures into the UI. (need to download reports as JSON) Every
.jsfile has its own different color on the chart (assigned randomly – except native browser calls, they are yellow) If you can't find Timings panel, check this thread To see who invoked Timer (looooong curve on flame chart), tick this checkbox in extended preferences:Search for 'tick' – it indicates that
ApplicationRef#tickwas most probably invoked byzone.js(ctrl+F for search over the flame chart)Some events may be caused by your browser extensions, to avoid that open the tab in incognito mode
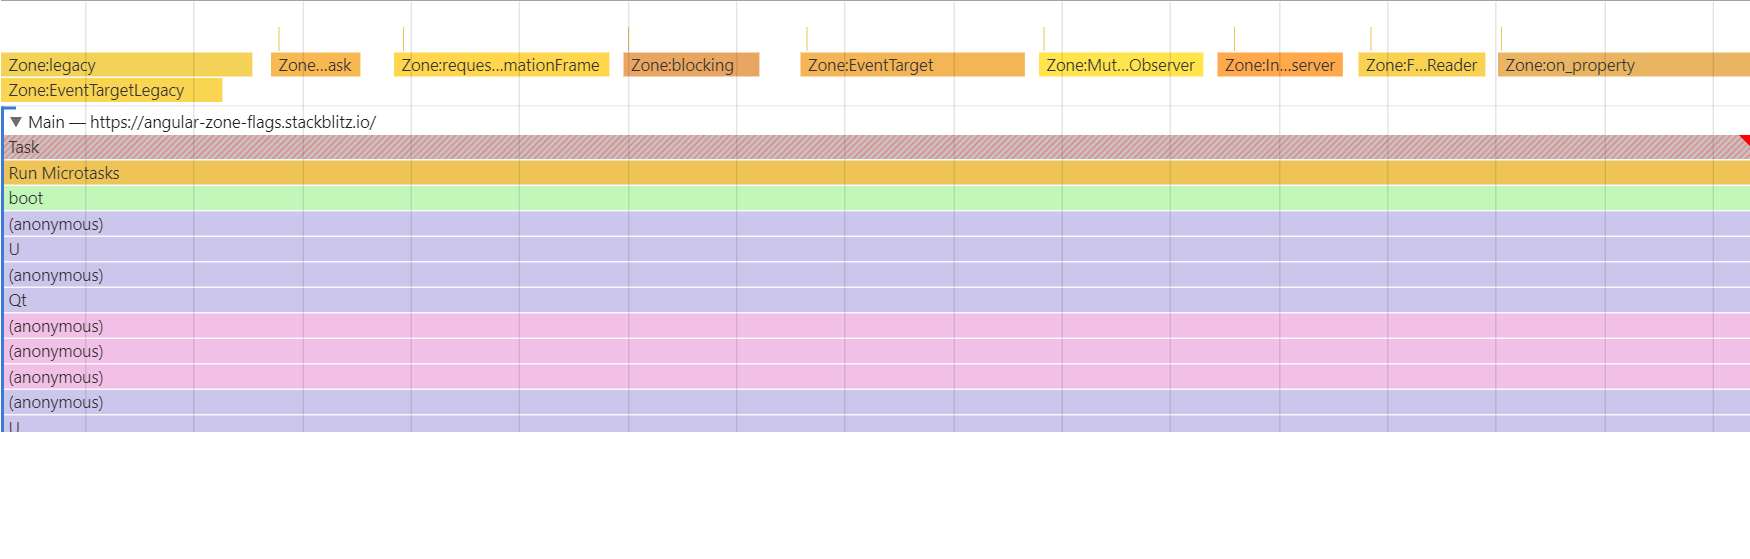
Timings
zone.js patching mechanism is also visible in the flame charts timing lane.
You can find the timing marks before the bootstrap phase of Angular.
 There every patched API is listed.
💡 Pro Tips:
- Unpatched APIs should not show up in the timing lane. This can serve as another check.
- If you can't see the timings panel, check this link
Breakpoints
- Zone Patches listed in flame chart
- Navigate to
zone.jscode to see if patch is invoked